

With most Mehlville and Lindbergh students still in all-virtual classes, the local school districts are closely tracking COVID-19 numbers to see when students can safely return to the classroom.
Both districts are tracking various state and county data points to see where coronavirus trends are heading. But that’s a more difficult task since Missouri, unlike some other states, has not provided any guidance to districts on what data to track and what measures to gauge to judge whether to be in school or out.
“We’ve had no consistent reporting of data and we’ve had no consistent guidance on where the measures should be,” said Mehlville Superintendent Chris Gaines. Instead, St. Louis County school districts have banded together as a region to figure it out on their own, lately turning to a model and risk map from the Harvard Institute of Global Health that tracks St. Louis County data and monitors when it’s safe for each age group of children to return to buildings.
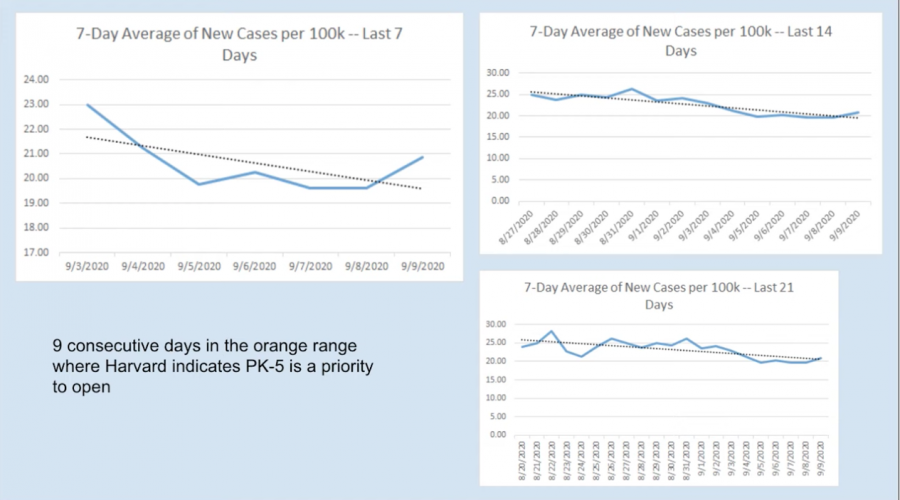
Mehlville was slated to send preschool and K-2 students back to hybrid/blended in-person school Tuesday, Sept. 22 in a decision triggered by the Harvard model logging 10 days in a row at the “orange” level, or 10-24 new daily cases per 100,000. That number stood at 23.5 at press time.
“That’s our data-based argument for why we’re starting to bring K-2 back,” Gaines said.
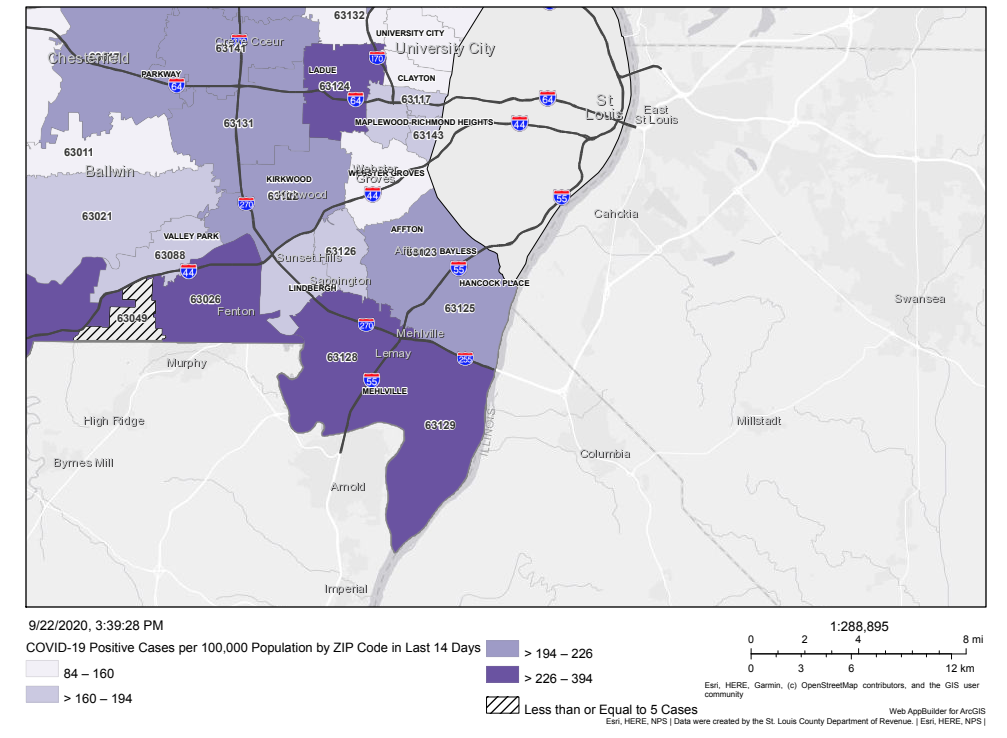
Mehlville tracks three ZIP codes daily — 63129, 63128 and 63125. After compiling those areas, the district examines combined numbers instead of each ZIP code on its own. To date, the Lemay ZIP code of 63125 has seen Mehlville’s lowest case numbers, while Oakville and Concord have at times been regional hotspots.
Lindbergh started K-3 in person and added fourth and fifth grades last week. Lindbergh tracks the six ZIP codes in its district along with the three surrounding it, for nine total ZIP codes. The district looks at each ZIP code individually and together.
Harvard model is key
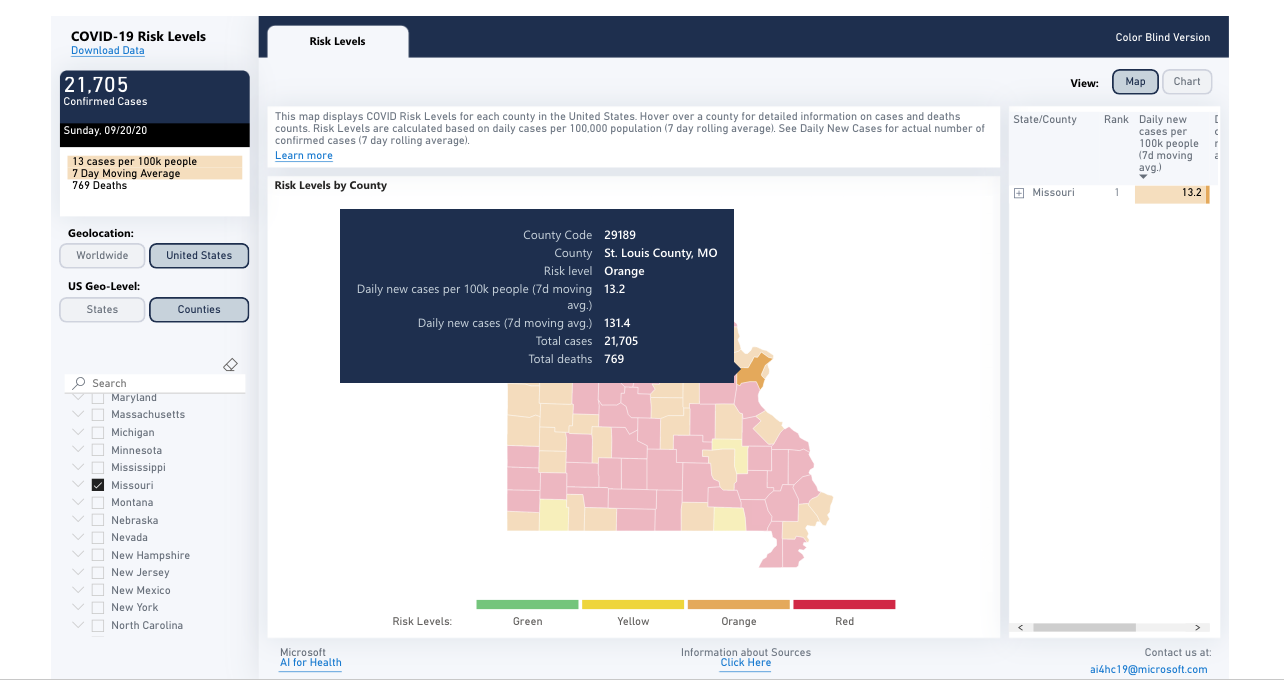
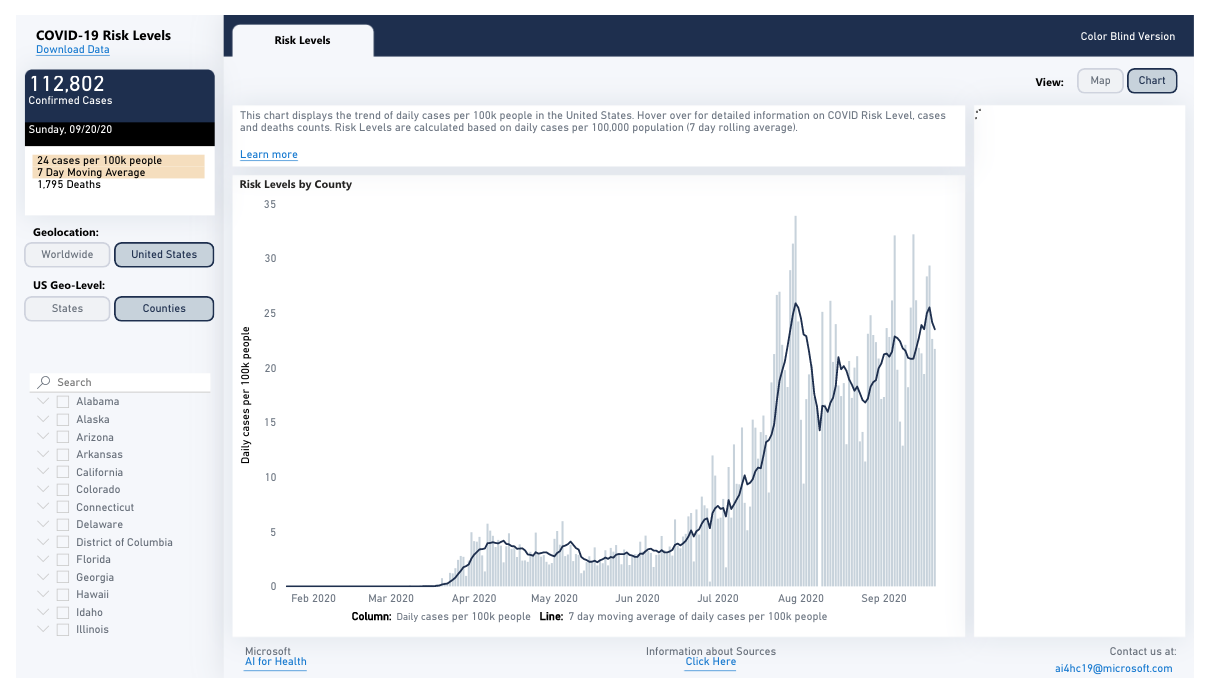
Both districts are eyeing the COVID risk level map from the Harvard Global Institute of Health, which tracks data for every county in the country and ranks it at red, orange or yellow, from worst to best, to recommend whether community spread has fallen to levels that allow school to reconvene safely. At press time, St. Louis County was orange on the Harvard scale, while much of rural Missouri was red.
Although Lindbergh monitors numbers daily, decisions only come from examining data in blocks of two weeks, so that “it’s not something that we see a positive metric and boom, we trigger another phase” instantly, said Superintendent Tony Lake at the Sept. 8 Lindbergh Board of Education meeting. Instead, the district looks at trends over time.
Although some parents questioned why Mehlville didn’t wait until two weeks after Labor Day to see if there was a spike, Gaines said “if the numbers are leaning towards getting kids back in school, if we can get them back in small groups, that’s going to be better for the education of the kids and then we would move to only shutting down where we had outbreaks. We could do better with the highest number of kids the sooner we can get them back.”
Schools have already shut down for cases this summer, but Gaines hopes to close classrooms before buildings and buildings before the district if an outbreak happens after students return in person.
With the lower case numbers allowing some Mehlville students to return to classrooms for the first time since March, Gaines said, “We’re excited to have kids back here … get our buses on the road, serve kids and we’ll just keep moving along. We’ve just got to get people to wear those masks, socially distance and avoid large groups — willpower, baby, it’s willpower, we can do it.”
When it comes to crunching the COVID-19 numbers, “I’m glad our superintendent was a former math teacher,” said Mehlville Communications Director Jessica Pupillo of Gaines.
A closer look at data sources
Lindbergh established a task force this month led by Lake’s “point man” on data, Assistant Superintendent for Human Resources Brian McKenney. The group, which includes Lindbergh High students, board members, teachers and Jessica Franklin, newly hired as the district’s lead nurse, will pore over the data weekly.
When it comes to what data to examine, “the answer is that it’s not a single piece of data, it’s a lot of data,” said McKenney. “It’s a very nuanced kind of situation here.”
Both districts are closely tracking new county data that shows cases by age group.
“As we’ve learned in this research, this virus acts differently depending on what age you are,” said McKenney.
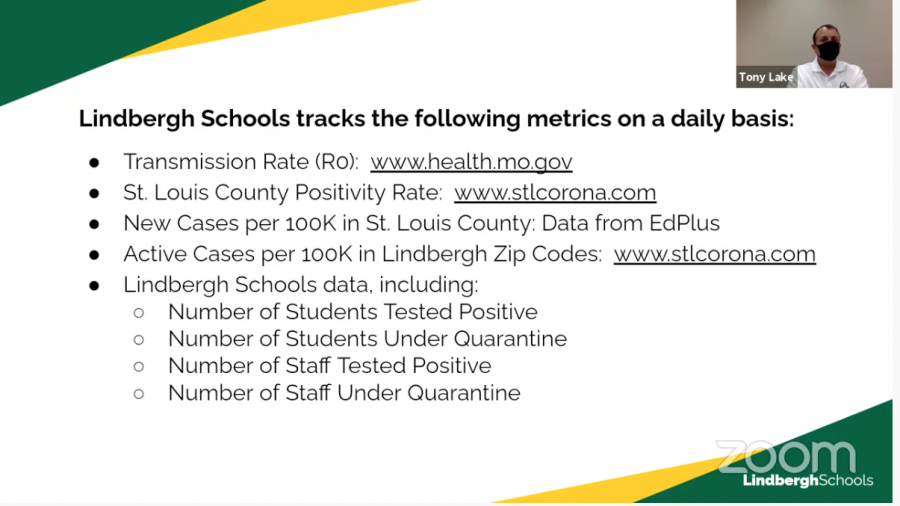
Mehlville tracks the transmission rate for the region that comes from the state; the positivity rate for the county from the county; trends in the district’s three primary ZIP codes for the last seven, 14 and 21 days; the percent change in daily cases for the ZIP codes for those same three time frames; and the seven-day average of new cases per 100,000 for the three ZIP codes, while also looking back at that number for the last seven days, 14 days and 21 days.
Lindbergh tracks the same transmission and positivity rates along with new cases per 100,000 for the nine ZIP codes, along with new county data dividing by age group. The district debuted a new online dashboard Sept. 7 that tracks current positive tests and quarantines among Lindbergh students, teachers and staff.
As seen in the data tracked by both school districts, South County and the entire area saw a huge spike in cases in July and early August, which had tapered off but then started to creep back up in early September, while still remaining much lower than those summer highs. For a month in August to early September, the St. Louis Metropolitan Pandemic Task Force repeatedly identified South County, especially the 63129 and 63128 ZIP codes, as the areas in the 15-county metropolitan region that added the most cases week over week.
St. Louis County data for the last two weeks at press time showed that despite the overall downward trend, nearly all of the Mehlville School District is shaded the dark purple that signifies the worst-hit ZIP codes. Lindbergh was a lighter purple, indicating fewer cases for 14 days prior.
“We’re trying to really drill down to say how is this virus affecting our community as a whole, but more specifically how it is interacting with our kids in our schools and our communities?” Lake said.
At press time, the Lindbergh dashboard showed positive tests and quarantines for, respectively: preschool or elementary students: 10 and 27; middle or high school: six and 59. One pre-K/elementary employee had a positive test. For quarantine, the district listed 14 elementary teachers, 11 from middle and high school and seven in Central Office or support services.
“The more people that know what we’re doing, the better off we are,” Lake said.
See the data that Lindbergh Schools showed at its Sept. 8 board meeting below: