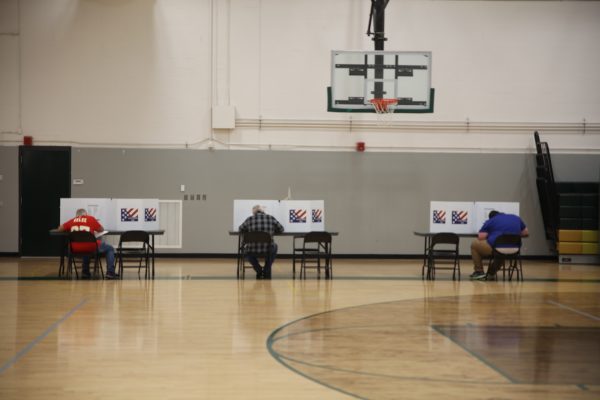
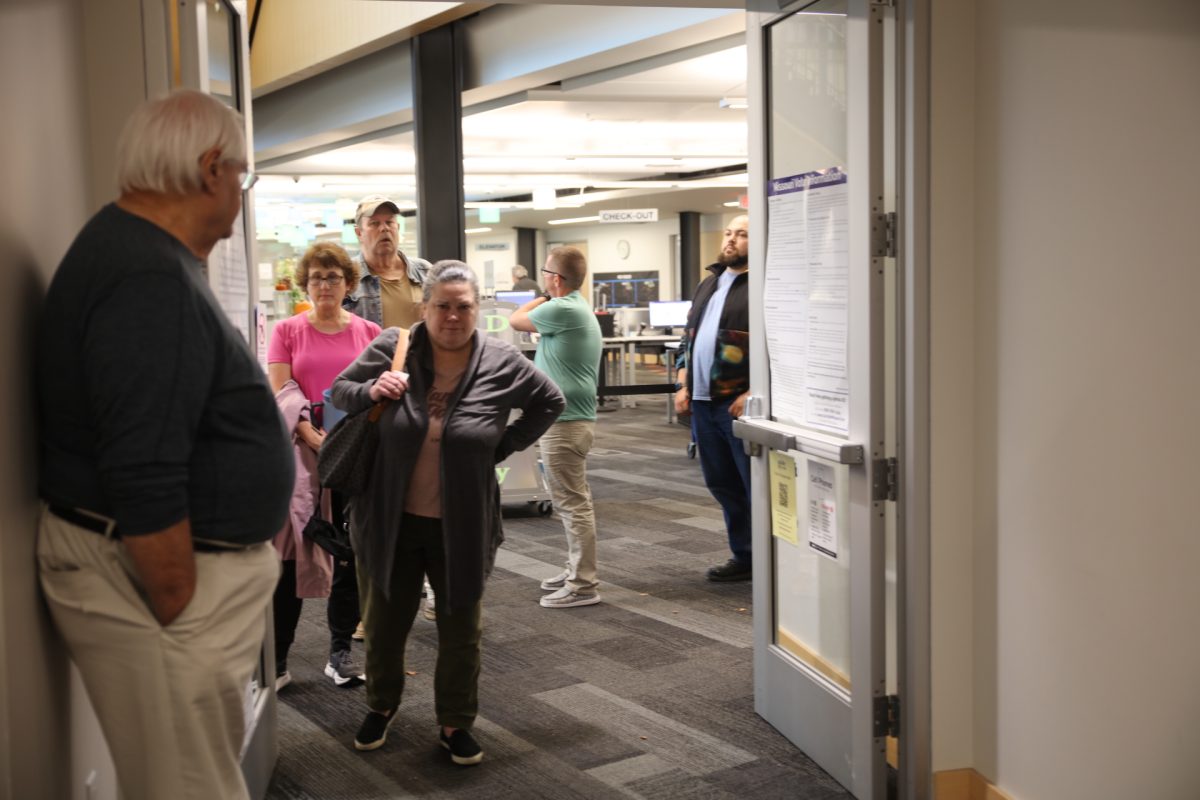
From United States president to local contests in Missouri, St. Louis County and South County, a number of important elections were decided Tuesday, Nov. 5.
Though St. Louis County has released 100% of votes, results are unofficial and will remain so until no later than Dec. 10, per the Missouri Secretary of State.
There were few upsets on election night in South County, as incumbents appeared to easily win reelection.
Incumbent Ann Wagner, R-Ballwin, will serve a seventh consecutive term after defeating Ray Hartmann (D) for the U.S. House of Representative District 2 seat.
In state legislative races all incumbents were victorious.
Incumbent Doug Beck, D-Affton, defeated Robert Crump (R) for the Missouri Senate District 1 seat; incumbent Michael Burton, D-Lakeshire, defeated Kenneth Abram (R) for the 92nd Missouri House District seat; incumbent Bridget Walsh Moore, D-Affton, defeated third-party candidate James O’Donnell (L) for the 93rd Missouri House District; incumbent Jim Murphy, R-Oakville, defeated Kyle Kerns (D) for the 94th Missouri House District seat; incumbent Michael O’Donnell, R-Oakville, defeated Deb Langland (D) for the 95th Missouri House District;; and incumbent Brad Christ, R-Sappington, defeated Leslie Derrington (D) for the 96th Missouri House District seat.
One newcomer to public office, Mike Archer (R), won the St. Louis County Council 6th District seat over Kevin Schartner (D). Incumbent Ernie Trakas, R-Oakville, lost his third-term reelection bid in the Republican primary against Archer on Aug. 6.
Statewide, Amendments 2 and 3 passed, legalizing sports betting and enshrining abortion rights in the state constitution, respectively.
Missouri Proposition A, an initiative that will increase the minimum wage to $15 per hour and require businesses to provide their employees with paid sick days, and Green Park Proposition M, imposing an additional 3% sales tax on all retail sales of adult-use marijuana sold within the city also passed.

South County
U.S. House of Representatives District 2
Ann Wagner (R) – 49.70%
Ray Hartmann (D) – 47.60%
Brandon Daugherty (L) – 1.88%
Shelby Davis (G) – 0.81%
St. Louis County Council, District 6
Mike Archer vs. Kevin Schartner
Mike Archer (R) – 52.52%
Kevin Schartner (D) – 47.48%
1st Missouri Senate District
Doug Beck vs. Robert Crump
Doug Beck (D) – 56.13%
Robert Crump (R) – 43.87%
92nd Missori House District
Michael Burton (D) – 54.27%
Kenneth Abram (R) – 45.73%
93rd Missouri House District
James O’Donnell vs. Bridget Walsh Moore
James O’Donnell (L) – 31.19%
Bridget Walsh Moore (D) – 68.81%
94th Missouri House District
Kyle Kerns vs. Jim Murphy
Kyle Kerns (D) – 43.61%
Jim Murphy (R) – 56.39%
95th Missouri House District
Deb Langland (D) – 38.46%
Michael O’Donnell (R) – 61.54%
96th Missouri House District
Brad Christ vs. Leslie Derrington
Brad Christ (R) – 55.23%
Leslie Derrington (D) – 44.77%
City of Green Park Proposition M
Yes – 59.75%
No – 40.25%
Other races of note
St. Louis County Council, District 2
Sudhir Rathod (R) – 32.86%
Gretchen Bangert (D) – 67.14%
County Council District, District 4
Rhonda Linders (R) – 17.19%
Shalonda Webb (D) – 80.26%
Theo Brown Sr. (L) – 1.55%
U.S. House of Representatives District 1
Andrew Jones (R) – 20.26%
Wesley Bell (D) – 74.81%
Rochelle A. Riggins (L) – 2.96%
Blake Ashby (Better) – 0.80%
Don Fitz (G) – 1.18%
U.S. Senate: Josh Hawley (R)
County results
Josh Hawley (R) – 35.76%
Lucas Kunce (D) – 61.57%
W.C. Young (L) – 1.11%
Jared Young (Better) – 0.83%
Nathan Kline (G) – 0.72%
State results
Josh Hawley (R) – 55.548%
Lucas Kunce (D) – 41.818%
W.C. Young (L) – 1.200%
Jared Young (Better) – 0.709%
Nathan Kline (G) – 0.674%
Governor: Mike Kehoe (R)
County results
Mike Kehoe (R) – 40.26%
Crystal Quade (D) – 57.80%
Bill Slantz (L) – 1.16%
Paul Lehmann (G) – 0.77%
State results
Mike Kehoe (R) – 59.124%
Crystal Quade (D) – 38.677%
Bill Slantz (L) – 1.382%
Paul Lehmann (G) – 0.753%
Lieutenant Governor: Dave Wasinger (R)
County results
Dave Wasinger (R) – 38.80%
Richard Brown (D) – 57.82%
Ken Iverson (L) – 1.72%
Danielle Elliott (G) – 1.66%
State results
Dave Wasinger (R) – 57.395%
Richard Brown (D) – 38.491%
Ken Iverson (L) – 2.119%
Danielle Elliott (G) – 1.995%
Secretary of State: Denny Hoskins (R)
County results
Denny Hoskins (R) – 38.34%
Barbara Phifer (D) – 59.27%
Carl Herman Freese (L) – 1.41%
Jerome Baur (G) – 0.97%
State results
Denny Hoskins (R) – 57.670%
Barbara Phifer (D) – 39.647%
Carl Herman Freese (L) – 1.689%
Jerome Baur (G) – 0.994%
State Treasurer: Vivek Malek (R)
County results
Vivek Malek (R) – 40.04%
Mark Osmac (D) – 56.86%
John A. Hartwig Jr. (L) – 2.09%
Reagan Haase (G) – 1.01%
State results
Vivek Malek (R) – 57.937%
Mark Osmac (D) – 38.035%
John A. Hartwig Jr. (L) – 2.802%
Reagan Haase (G) – 1.227%
Attorney General: Andrew Bailey (R)
County results
Andrew Bailey (R) – 39.76%
Elad Jonathan Gross (D) – 58.23%
Ryan L. Munro (L) – 2.01%
State results
Andrew Bailey (R) – 59.795%
Elad Jonathan Gross (D) – 37.907%
Ryan L. Munro (L) – 2.298%
Statewide amendments and propositions
Amendment 2 – Sports Betting Initiative
County results
Yes – 53.48%
No – 46.52%
State results
Yes – 50.128%
No – 49.872%
Amendment 3 – Right to Reproductive Freedom Initiative
County results
Yes – 67.37%
No – 32.63%
State results
Yes – 51.742%
No – 48.258%
Amendment 5 – Osage River Gambling Boat License Initiative
County results
Yes – 49.37%
No – 50.63%
State results
Yes – 47.602%
No – 52.398%
Amendment 6 – Levying of Fees to Support Salaries of Law Enforcement Personnel Amendment
County results
Yes – 35.42%
No – 64.58%
State results
Yes – 39.425%
No – 60.575%
Amendment 7 – Require Citizenship to Vote and Prohibit Ranked-Choice Voting Amendment
County results
Yes – 59.91%
No – 40.09%
State results
Yes – 68.459%
No – 31.541%
Proposition A – Minimum Wage and Earned Paid Sick Time Initiative
County results
Yes – 69.52%
No – 30.48%
State results
Yes – 57.580%
No – 42.420%
St. Louis County propositions
Proposition A
Yes – 67.65%
No – 32.35%
Proposition C
Yes – 61.89%
No – 38.11%
Proposition O
Yes – 77.70%
No – 23.30%


